
There is no inflation here....
 |
| Ben Bernake, Fed chairman |
 |
| Ben Kenobi, Jedi Master |
Move along...
Inflation: A process of continuously rising prices or equivalently, of a continuously falling value of money.
Well, if a falling value of money is the definition of inflation maybe we should check on how the U.S. Dollar has been doing the last decade. Hmmmm...if a 45% decline in 10 years isn't "continuously falling" I'm not sure what is.
 |
| This your dollar on "Bernake" drugs... |
 |
| Curious. |
Two Very Different Streets
Average Joe Sixpack, Main Street USA
About 25% of the average family's budget goes to food and fuel. The charts below illustrate what has been happening to 90% of America the last decade and accelerated dramatically as a result of the bank bailouts in 2008 and over $2.4 trillion in "Quantitative Easing" since then.
Savers gutted by $500 billion per year

Gas Prices up 46%.

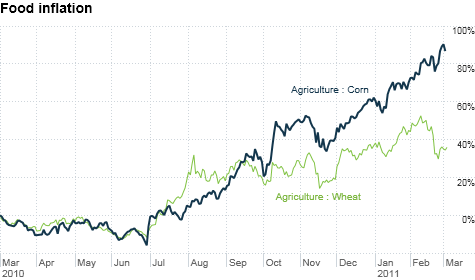
Food Prices up 60%
Working harder for less

Real Wages declining constantly

Unemployment completely unaffected by all the "stimulus"


Top 10% that own 85% of all equities
Wall Street, USA.
Wall Street, USA.

A 106% rise in the SP-500, courtesy of the Federal Reserve increasing bank reserves via Quantitative Easing begun in March 2009. You might believe the company line that printing trillions of dollars to bail out Wall Street, "save the system"and manipulate the stock market "higher than it otherwise would be" is "good" for everyone. You would be wrong to do so. Look very carefully at the next two charts and you'll see EXACTLY who gets the benefits. We're pretty clear on who's getting the shaft from the charts above.
 |
| click to enlarge |
 |
| Gee...I look just like the incomes of the top 10%! |
The FED can't force the markets up by increasing the money supply without the price of everything else rising as well. Including food and gas. If you are a Wall Street bank, a savvy trader, or have large amounts of stock holdings you get the temporary benefit of increased wealth and earnings from printing money. However, Average Joe Sixpack gets higher prices across the board without the benefit of higher wages and stock holdings to offset them. He gets stuck paying for the expensive dinner, but doesn't get to eat it.

 If this sounds like a "raw deal" for Joe, it's because it is. In order to sell it our masters need a good sales pitch.
 The FEDI MIND TRICK.
The preferred measure by the Federal Reserve of core inflation in the United States is the Core Personal Consumption Expenditures Price Index (PCE). When our masters smugly lecture us commoners about low inflation, this is what they base those lies on. It's easy to get a "low" inflation reading if you strip out rising prices, overweight the falling prices, or simply ignore reality. Not one to do things half-ass, the Fed conveniently does all three. |
| Eh? |
Food

 Energy
2. Overweight falling prices.
The heaviest weighting in CPI calculation is...housing, at 40%. Home prices are falling, so this is a real positive development for keeping inflation "in check" for the Fed. Average Joe feels much better being $100,000 underwater on his house knowing it's helping to fight inflation.


Per Investopedia: Substitution
"The idea is that as prices rise (or incomes decrease) consumers will replace more expensive items with less costly alternatives. Although beneficial to some (i.e. discount retailers), in general, the substitution effect is very negative in nature, as it limits choice. This is true not only for products, but also for services. Examples of the substitution effect in action can sometimes be observed over the winter holiday season, where, in lean economic times, discount retailers often hold up well."
Per Shadowstats.com: Hedonics
When gasoline rises 10 cents per gallon because of a federally mandated gasoline additive, the increased gasoline cost does not contribute to inflation. Instead, the 10 cents is eliminated from the CPI because of the offsetting hedonic thrills the consumer gets from breathing cleaner air. That new washing machine you bought did not cost you 20% more than it would have cost you last year, because you got an offsetting 20% increase in the pleasure you derive from pushing its new electronic control buttons instead of turning that old noisy dial, according to the BLS.
Here is the actual text of the Fed's preference for using the PCE indicator to measure inflation. I took the liberty of highlighting the funny parts.
Since February 2000, the Federal Reserve Board’s semiannual monetary policy reports to Congress have described the Board’s outlook for inflation in terms of the PCE. Prior to that, the inflation outlook was presented in terms of the CPI. In explaining its preference for the PCE, the Board stated: The chain-type price index for PCE draws extensively on data from the consumer price index but, while not entirely free of measurement problems, has several advantages relative to the CPI. The PCE chain-type index is constructed from a formula that reflects the changing composition of spending and thereby avoids some of the upward bias associated with the fixed-weight nature of the CPI. In addition, the weights are based on a more comprehensive measure of expenditures. Finally, historical data used in the PCE price index can be revised to account for newly available information and for improvements in measurement techniques, including those that affect source data from the CPI; the result is a more consistent series over time. —Monetary Policy Report to the Congress, Federal Reserve Board of Governors, Feb. 17, 2000
In explaining its preference for the PCE, the Board stated:
"The PCE chain-type index is constructed from a formula that reflects the changing composition of spending and thereby avoids some of the upward bias associated with the fixed-weight nature of the CPI. The PCE rises about one-third percent less than the CPI, a trend that dates back to 1992. This may be due to the failure of CPI to take into account substitution. Core inflation eliminates products that can have temporary price shocks (i.e. energy, food products). Core inflation is thus intended to be an indicator and predictor of underlying long-term inflation"
The Federal Reserve deliberately modifies it's inflation calculations to lessen the obvious effects of inflation and publicly defend their actions. They cause inflation by increasing the money supply, thus debasing our currency by the exact amount they printed. 90% of America has no access to this "generosity" but get to pay the price regardless. If inflation has the gall to appear in their "modified" calculations, they can change those calculations retroactively to adjust the..."upward bias". In December of 2010 inflation per the CPI was .01%. As measured in 1980 it would be 8%. As measured in 1990 it would be 4%. The congressional super-committee tasked with reducing the defecit is planning on "adjusting" the CPI yet again. At last, bi-partisan support for something.
 |
| No Way! |
|
| There's no inflation here.. |
 |
| Move along... |

