We make money the old fashioned way...

We make money the old fashioned way...
We print it.

Friday, February 26, 2010

The problem with the plan...

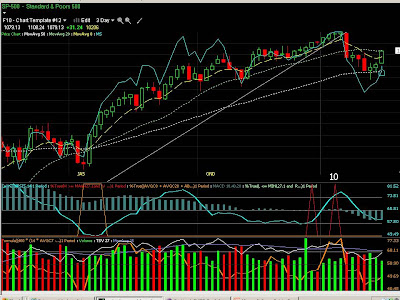
Ben Bernake reiterated for the 20th time in 20 Fed meetings this week that the Fed funds rate will remain at zero for "an extended period" in large part because of "persistently high unemployment".

I've illustrated my concern with this philosophy below.


This is just my opinion but I'm having a hard time seeing how this helps us waaayyy down here on the bottom of Main St. The people happy with the status quo seem to be the ones closest to the "free money" spigot. You know, the ones who paid out the highest bonuses in history while the rest of us are buried in debt and falling fast. Rhymes with "Gall", ends with "street".

Damn Right!

This story speaks for itself...read on for some inspiration.

Georgia man rams shooter's car

Thursday, February 25, 2010

Spin Class

Today's "Say WHAT?" headline is

AP: "Jobless Claims up because of bad weather"

Jobless claims rose "unexpectedly" (they are always unexpected for economists and our mainstream media cheerleaders). The AP's already sniffed out the cause for us with some crackerjack research. I did some quick investigating of my own and managed to find some excerpts from the due dilegence:

Reporter: "You just laid off another 10% of your workforce. Is that because of the snow?"
Employer: "Business is down 60% from last year, my line of credit has been cut off and the interest rate on the outstanding balance doubled, and half my clients are no longer in business. Revenue to replace those clients will have to be from some completely new source that hasn't materialized yet. I had to cut employees to allow what business and people I have left to work a few more months before we all go under."
Reporter: "But it was REAALLY snowing hard when you laid them off, right?"
Employer: "Yes".

Notice how our reporter ferrets out "the truth" while nimbly avoiding the subject's actual answer. Never let facts get in the way of a good Cause and Effect story. That's Spin 101 for today kids!

I wonder if you get a free "Kool-Aid" packet with your AP subscription to wash down the news with...

Sunday, February 21, 2010

Extreme Indicators

This is a quick lesson in timing. I call these extreme indicators, and they indicate the percentage of stocks in the trading universe (over 7000) that are trading 2 or more standard deviations above or below their 40 day price moving average. Stocks generally bounce along this average in the same direction of the market, whether that is up or down. Once in while though the market gets rowdy (volatile) and prices are distorted out to levels that make a return to that 40-day average price very likely (mean reversion). It is at these levels some of your best trade setups occur. There's no single indicator that can perfectly time a market swing (the fabled silver bullet), but these two are very reliable for letting you know the market's primed to reverse course, and soon. I have them pictured below with the SP-500 beneath them, so you can judge for yourself. I drew arrows to help illustrate how I use these. Note how the spikes often precede the market move by a few days...this is vital. The spikes usually peak and start coming down before the market reverses, giving you advance warning of a likely turn and time to set up trades.

Telechart T2112, the % of stocks trading 2 standard deviations above their 40-day PMA. This is what "Overbought" looks like, and I'm looking to short here or at the very least not go long, as a selloff is near. Keep in mind most of these moves are of 5% or more on the SP-500, even though it might not look like much on the chart.

Telechart T2116, indicating the % of stocks 2 standard deviations BELOW their 40-day price moving average. When you hear the term "Oversold" from an analyst, this is what it looks like. Note the correlation between spikes in this indicator and sharp reversals in the SP-500 in the bottom half of the chart. You should be getting long here, or at the least not shorting, as a rally's approaching.

Look at the top part of the charts above. Look to the center pane of the top chart, immediately beneath where the Month is. There is a single wavy line that follows along with whatever I place in the top chart, with it's numerical value on the right side. This is called the "Ultimate Oscillator", and is a very good overbought/oversold indicator. When this gets above 80 or below 20 prices are getting pushed very far from their averages..notice how it's usually above 80 when the indicators peak. Immediately below that you'll see the third pane with two wavy lines that intersect often. This is the 35-day Time Segmented Volume and it's 21-day moving average. What I look for here is large spreads between the two lines...the further they are apart the more overbought or oversold the market is becoming. When you've got all three events occuring simultaneously you've got a very nice setup.

The market will be moving very quickly either up or down for these to spike, and you'll hear things like "The dow was up triple digits for the third day in row!" or "Dow posts biggest one-day loss in 6 months!" on TV during these times. The gang at the water-cooler will be saying things like "I've got to get into this market!" or "I just sold everything..who knows where this will end." But you will have your handy-dandy "extreme indicators" telling you differently. Hopefully this will help you time your trade, or at the very least not do the exact opposite of what you should be doing and getting clobbered by a reversal. That hurts...believe me I know.

Friday, February 19, 2010

A trade setup..

I try to find at least three points to play a pivot..this one's got at least five. Sold short 50 DRN @ 132.44 today, so we'll see how much longer the market can rise on crappy volume. I feel the ending of "Printin' Ben's" 1.2 trillion MBS purchase program will have detrimental effects on this soon...
DRN Fibonacci retracement into 50-61.8% zone
MSCI REIT index that DRN tracks approaching price resistance. Note the Stochastics in the middle are indicating downtrend(red line above green) so this play is technically with the trend
SP-500 PUVD shows up well on the 3-day
T2108 no longer oversold
T2106 overbought
REIT bollinger band resistance

Tuesday, February 16, 2010

Deja Vu all over again

Good news! Citigroup, the posterchild for "Too Big to Fail", has realized the error of their ways, vowed never to endanger the system again and is working doggedly to dismantle all the incomprehensible instruments of mass financial destruction that helped get our country into this mess. No more CDO's. They're getting back to traditional banking and leaving the crazy stuff to the private firms where if they blow up it's more like an M-80 than 5 kilo nuke. If only that was true..

Marketwatch-The all-new risk-free CLX!

Say What? Well, they're bankers. Maybe having a government guarantee that keeps you solvent and employed no matter how bad you screw up isn't the formula for long term success and risk aversion we'd hoped. Surely the Mortgage lenders and real-estate speculators have learned the painful lessons of the credit and housing bubble implosion. Haven't they?

WSJ-House-flipping making a comeback

Ummm..wait a minute here. So a bank that should have gone bankrupt but was saved by the taxpayers instead, and has kept most of it's upper level management intact, is unloading all this property fast at huge discounts? Why? Because there's just so much inventory they can't keep up? Yet they somehow find the hours to cook up a spanking new collateralized time bomb. Weird. They're acting like they can't lose their jobs, don't have to take the bank's losses, or pay for any.... Ohhh crap..

Reuters: Unlimited losses for Fannie and Freddie

I don't know about you but I'm a lot more pissed off about what's happening AFTER the bailouts than the bailouts themselves. Why does anyone think that this won't happen again? I'm pretty sure no one outside WA-WA land (Washington and Wall St) thinks we're home free. Looks like the same-ol same-ol from here. But I'm a skeptic. I"m sure with a shiny new "CLX" we can't lose.


Sunday, February 14, 2010

A to B..going nowhere fast.


Here we have the SP-500 for the last 10 years (click for bigger). Points A and B are roughly 10 years apart. If you went all in long the index in 1998 and made it through the last 12 years without hitting the "SELL" button, you'd have made..zero. And burned through several cases of Rolaids in the meantime. Same thing if you'd shorted the index. The big $ signs represent Federal Stimulus efforts. The technical bear case for the chart is evident, as you'll find that double-top formation in chapter 1 of every trading book ever written. What you won't find often is a confirmed double top on a 25-year chart of the U.S. economy, which is what this represents.

Chart patterns bust though, so I scratch around for some bullish evidence that point B (which I'm biased towards because it's now) is really waaay better than point A. That's where the involuntary nervous tic in my left eye starts..

In 1999 median household income was $50,641 and the national debt was about $5.65 trillion.

In 2007 median income was $50,233, and the national debt was about $9.1 trillion.

Knowing what's happened to household incomes, employment, home values, savings and the national debt since 2007, you might start developing a nervous tic as well...and thinking that putting all your savings at the offices of Madoff,Stanton,Stearns and Lehman might not be the way to go for financial freedom. Or solvency for that matter. I believe this dynamic has created the leveraged ETF explosion..where volatility is the game and you can attempt to make money while the real economy and stock market goes nowhere..fast.

Saturday, February 13, 2010

What's a Trillion anyway?

Unidentified Congressmen seen arriving for budget talks..


While we're on the subject of budgets just how much is a Trillion anyway? Our government tosses that number around like it's "the new billion". It's hard to get your head around a number normally reserved for measuring distances between galaxies. Especially when used in the same sentence as "budget". To help visualize our government's profligate spending habits, imagine a giant spool of $100 bills, single file and end-to-end. Now make it $1 trillion long and attach it to a Blue Angel (spending I do support because it's so freakin' cool!). Now kick 'er up to Mach 1 and book it until you run out of cash. Check the video to get a feel for the speed.


Now you're peeling off C-notes at the speed of sound to the ooohs and aaahs of the crowd on a Saturday afternoon. Imagine that one of three lucky contestants who guesses closest to when the spool runs out gets to keep the cash. Who wins?

Person A, who thinks $100 is kind of a lot and that jet's going kinda fast says "10 minutes!"
Person B, (suspicious that that person A likely works in the congressional budget office) does some quick math and comes up with "Sometime next Thursday."
Person C, a faithful watcher of "The Price is Right" belts out "One minute more than next Thursday!"

The fact is you'd be cruising for a month and a half. You'd be streaming out Benjamins for 50 straight days. You'd circle the equator 38 times before your trillion ran out. Peeling off $100 bills for 120,479 consecutive flight hours at Mach 1. You math whizzes probably noticed person A guessed roughly 1 million and person B guessed about 1 billion. Our currrent Federal budget deficit is projected at over 1.46 trillion for this year, 1.6 trillion next year and "somewhere north of 1 trillion" the year after that.

Money we borrow from countries and investors the world over, with them thinking we'll pay it back..eventually. We also just flat-out print money when too many people want their money back at the same time...2.1 trillion and counting since 2007.

So what you say? Isn't that what printing presses were made for? Our leaders sure seem to think so. We must change that mindset, top to bottom, and here is why.


Yahoo Finance "The debt will keep growing"

Let's keep voting them out till we find someone who gets it and acts to change it... Representative Buchanan seems to be trying here. Not raising isn't the same as drastic cutting, but hey it's Congress. Baby steps..